Mortgage Deal Forecasting: Predict Which Loans Will Close

Mortgage deal forecasting is the habit of estimating, file by file, which loans will fund, roughly when, and which ones are quietly slipping. It is not a rate forecast and it is not a promise to anyone. For a loan officer or broker, it comes down to three things: objective pipeline stages, a closing probability that updates as milestones clear, and a monthly comparison of what you predicted with what actually funded. This guide shows how to build that, and how to point the same logic at your past-client database to find the next refinance or HELOC deals.
TL;DR
- Forecast loan by loan, not with one blended pull-through percentage. Stage, time in stage, product and lead source all change the odds.
- Define stages as observable events (application, processing, underwriting decision, conditions outstanding, closing scheduled, funded), never as how optimistic you feel.
- Watch time in stage. A file that sits longer than normal is your earliest warning of fallout.
- Freeze a dated forecast each month, then compare it with funded loans and group your misses by reason.
- Use the same signals (rate gap, equity, stage) to decide whom to call first, in your pipeline and in your database.
Table of Contents
- What mortgage deal forecasting actually means
- Build stages that reflect real events
- Estimate which leads will close, and when
- Watch the metrics that expose stalled loans
- Use forecasts to decide who gets your next call
- Forecast the deals you have not started yet
- Our perspective
- How LoanOfficer.ai supports your forecast
- Check your forecast every month
- FAQ
- Sources
What mortgage deal forecasting actually means
Search results for this phrase are crowded with 30-year rate predictions. Those matter to you as context, but they answer a different question: where will the market go. Deal forecasting asks where your own business will land. How many of the files in your pipeline will close this month, how many are at risk, and how many applications do you need to start now to fill the months ahead?
A useful forecast separates three groups: files expected to close, files at risk, and files already funded. For each expected closing date, write down the evidence behind it and who owns the next step. A date with no evidence and no owner is a hope, not a forecast. This framing follows a published method for forecasting monthly closings from pipeline stages, which also stresses that the output is an estimate, never a funding promise or an underwriting decision.
The same discipline shows up in lender analytics. McKinsey’s work on advanced analytics in mortgage originations describes using forward-looking demand projections and lead prioritization based on likelihood of converting to an application and spend per lock. You do not need a data science team to borrow the idea. You need clean stages and consistent notes.
Build stages that reflect real events
The forecast is only as good as your stages. If “hot” and “warm” are stages, you are forecasting your mood. Replace them with events you can verify:
- Application taken: the borrower has given the basics and you have what you need to issue a Loan Estimate. The CFPB says a lender must provide one once the borrower supplies name, income, Social Security number, property address, estimated property value and desired loan amount.
- In processing: documents are arriving and being reviewed.
- Underwriting decision: approved, suspended or denied.
- Conditions outstanding: the file is approved but waiting on items.
- Closing scheduled: a date is on the calendar.
- Funded.
Keep the list short and the definitions strict. A borrower moves to the next stage when the event happens, not when you feel good about the file.
What data to capture at each stage
Two kinds of information feed the forecast: the borrower’s profile and the file’s progress.
On the profile side, the CFPB tells borrowers to gather recent pay stubs, two years of W-2s and tax returns, other income documentation, recent bank statements and proof of the down-payment source. It also warns that inaccurate information can cause costly surprises and incomplete documents may be rejected. That is a forecasting fact as much as a borrower tip: a file with missing or messy documents is a slower, riskier file, so note document completeness in the record.
Beyond documents, practitioners commonly weigh credit-score stability, debt-to-income ratio, cash reserves and employment type. Self-employed borrowers with thin reserves will usually need more time and more follow-up than a salaried borrower with a cushion. Record those flags early.
On the progress side, log the date a file entered each stage, the lead source, the loan purpose, the product and the lock term. Those five fields let you segment later.
Estimate which leads will close, and when
The simplest model that works is a closing-probability score per file, updated as milestones clear. Start with a rough percentage for each stage based on your own history, then adjust for the borrower profile and loan type. When the appraisal comes back clean or conditions are cleared, the score goes up. When a borrower goes quiet for a week, it goes down.
Resist one blended number. Optimal Blue’s pipeline modeling guidance argues for standardized stages, stage-specific transition probabilities, time in stage, segmentation by product and channel, and lagged rate effects, rather than a single fallout ratio applied to everything. A purchase file from a realtor referral with a 45-day lock and a rate-and-term refinance from a web lead behave differently, so they should not share one percentage.
A worked example
Suppose you have 20 files in play:
| Stage | Files | Your historical close rate | Expected closings |
|---|---|---|---|
| Closing scheduled | 4 | 95% | 3.8 |
| Conditions outstanding | 5 | 85% | 4.25 |
| In processing | 6 | 65% | 3.9 |
| Application taken | 5 | 45% | 2.25 |
| Total | 20 | 14.2 |
The percentages here are placeholders to show the arithmetic. Use your own history. The point is that the forecast is about 14 closings, not 20, and the table tells you where the gap lives: the five early-stage files carry the most uncertainty, so they deserve the most attention this week.
Watch the metrics that expose stalled loans
A forecast tells you what you expect. These measures tell you when reality is drifting away from it:
- Conversion into each stage: what share of files that reach one stage reach the next.
- Median time in stage: how long a typical file waits at each step.
- Stale percentage: how many files have had no meaningful activity in a set number of days.
- Loss reason: why files died (rate, competitor, credit, documents, borrower went silent).
Compare each by lead source and by owner, as the stage-based forecasting method suggests. If one source converts to application well but dies in processing, the problem is not lead volume, it is what happens after the lead is captured.
Time in stage is the one to watch daily. Optimal Blue reports that fallout probability often rises once a loan stays in a stage longer than normal, particularly early on while the borrower’s commitment is still forming. The practical rule: set a “normal” duration for each stage, and treat anything past it as a call you make today.
Rate sensitivity is uneven too. The same source notes it varies by stage, lock-term length, loan purpose and product type, with early-stage and longer-lock files generally more exposed to rate-driven fallout. When rates move, call your early-stage and longer-lock files first.
If you want these views without building spreadsheets, our pipeline management features keep every file by stage in one place. For a deeper walkthrough of the method, see our practitioner’s playbook on mortgage pipeline forecasting.
Use forecasts to decide who gets your next call
A forecast earns its keep when it changes your calendar. McKinsey points to lead-source conversion to application and spend per lock as the metrics for prioritizing leads, and recommends routing by lead complexity and lock propensity. For a solo loan officer, that translates into a simple daily order:
- Files past their normal time in stage.
- Scheduled closings with open items.
- New leads from sources that convert best, called within minutes. Our speed-to-lead feature is built for that first-minute response.
- Everyone else on a set cadence.
For borrowers who are pre-approved and house hunting, one published example of a status-aware sequence runs confirmation on day 1, a search nudge on day 7, a personal check-in on day 21, a market update on day 45 and renewal outreach near day 60, stopping once the borrower is under contract. Treat it as a template to adapt, not a rule. The principle holds: the message depends on the stage, and it stops when the stage changes.
Realtors belong in the forecast as well. Track which agents send you files that actually fund, not just files that start. Our guide to mortgage lead routing and the lead source attribution article show how to tie sources to funded loans so your forecast reflects the channels that pay.

Forecast the deals you have not started yet
Your pipeline shows this quarter. Your database shows next quarter. Past clients and old leads carry the information you need: their current rate, their estimated equity, and how long they have held the loan.
A workable approach, drawn from Experian’s guidance on data-driven lending: compare each borrower’s current rate and equity against what is available now, and use credit, mortgage trade-level and AVM data to flag rate-and-term, cash-out, streamlined-refinance and home-equity candidates. The same piece notes that over 83% of mortgages carry a rate below 6.5%, which tells you rate-and-term targeting should start with borrowers whose rates are actually above today’s market.
Timing is where rate forecasts do help. Refinance demand swings hard with rates. In the week ending January 16, 2026, refinance applications were 61.9% of the total and the 30-year fixed rate averaged 6.16%. By the week ending May 22, 2026, the rate was 6.65% and refinances were 37.5% of applications. You do not need to predict the next move. You need a list ready so that when a threshold is crossed, you call within hours.
That is the idea behind signal-driven sequencing: prioritize borrowers whose rate gap or equity has just crossed a meaningful threshold, and treat equity-driven opportunities separately from rate-driven ones. A borrower with a 7% rate and modest equity gets a rate conversation. A borrower with a low rate and a big jump in equity gets a HELOC or cash-out conversation. Different calls, different scripts.

Optimal Blue makes the same point about continuously monitoring portfolio and lead data against rates, home prices and equity so the loan officer reaches the borrower at the relevant moment.
Our perspective
We built LoanOfficer.ai on a simple belief: most loan officers do not have a forecasting problem, they have a follow-up problem. The forecast is only as good as the last time someone called the borrower.
When a file stalls, it is rarely a mystery. A lead waited too long, a document request went unanswered, or a past client never heard that their rate gap had opened. Those are timing failures, and software should catch them before you do.
That is why we put AI follow-up, speed-to-lead, a smart dialer, AI appointment scheduling, rate monitoring and refi and HELOC detection in one platform, with Property Pulse watching borrower equity and rates so your database feeds your pipeline instead of sitting idle. Our aim is for you to spend your day on conversations that move a loan forward, not on chasing spreadsheets.
Forecast honestly, freeze your numbers each month, and let the misses teach you. The loan officers who do this build pipelines they can count on.
Jared Hart
How LoanOfficer.ai supports your forecast
A forecast is only useful if your stages stay current, so the work has to happen where you already spend your day. LoanOfficer.ai gives you pipeline management by stage, AI-driven follow-up that keeps early-stage files from going cold, rate monitoring, and refi and HELOC detection across your existing database. Property Pulse sends automated rate watch and refinance alerts so you see which past clients have just crossed a threshold.
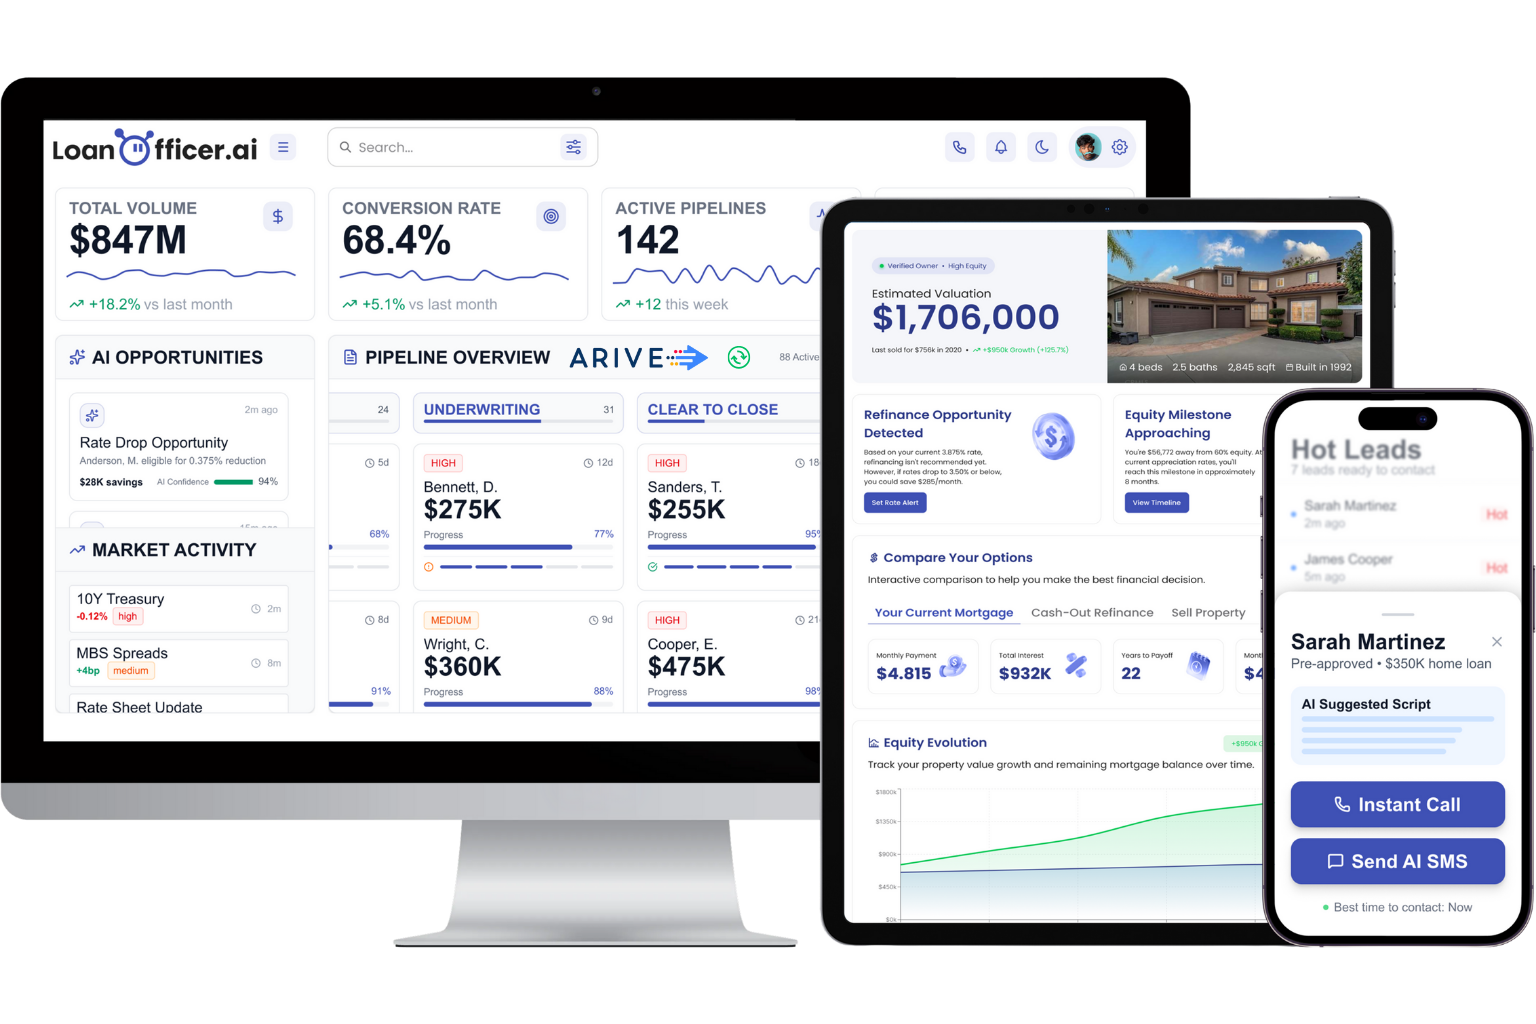
If you are new to the platform, your first 24 hours walks you through setup, and the lead conversion path covers the follow-up habits that keep the forecast honest. Refinance-focused teams can see how it fits on the page for refinance specialists.
Check your forecast every month
Forecasting without review is guessing with extra steps. A simple monthly loop:
- Freeze the forecast at a set date and keep the original untouched.
- Reconcile after month-end against funded loans, postponed files, cancellations and loans that were never in the forecast.
- Group the misses by reason and stage. This is how you improve your local assumptions and capacity planning.
- Adjust stage percentages with the new data, and keep the changes small.
Reliability comes from historical data supporting probabilities across your products and channels. After three or four months you will know which stages you overestimate, which lead sources you undervalue, and how much slack to build in for rate swings.
FAQ
What is mortgage deal forecasting?
It is a loan-level estimate of how many files will close in a given period and when, based on pipeline stage, time in stage and borrower and loan characteristics. It is reconciled against actual funded loans each month. It is a planning tool for you, not a commitment to the borrower.
How many stages should my pipeline have?
Six to eight is enough: application, processing, underwriting decision, conditions outstanding, closing scheduled and funded, plus an early lead stage. Each should be an event you can verify, not a feeling. More stages add data entry without adding accuracy.
How often should I update my forecast?
Update individual file scores whenever a milestone clears or a file sits past its normal time in stage. Freeze and review the full forecast monthly, comparing it with what funded. Check early-stage and long-lock files more often when rates move sharply.
Can rate forecasts help me find refinance deals?
Yes, but use them for timing rather than prediction. Keep a ready list of past clients ranked by rate gap and equity, so you can call as soon as market rates cross a level that helps them. Treat equity-driven borrowers separately from rate-driven ones.
Sources
- Forecast monthly closings from mortgage pipeline stages
- Deploying advanced analytics in mortgage originations (McKinsey)
- What information do I have to provide a lender to receive a Loan Estimate (CFPB)
- Create a loan application packet (CFPB)
- Build a Predictable Commission Forecast in Austin, Texas
- Mortgage Pipeline Modeling for Data-Driven Lending Decisions (Optimal Blue)
- Mortgage Pipeline Modeling, fallout and rate sensitivity (Optimal Blue)
- Pre-approval follow-up cadence
- How to Optimize Housing Lending with Data-Driven Strategies (Experian)
- MBA Weekly Survey, week ending January 16, 2026
- MBA Weekly Survey, week ending May 22, 2026
- Predictive Mortgage Analytics: Turning Signals Into Action
- Recapture borrowers as rates drop (Optimal Blue)
Ready to see your own pipeline and database working together? Start the $1 14-day trial of LoanOfficer.ai.
