Mortgage CRM Dashboards: The Loan Officer’s Playbook
An effective mortgage CRM dashboard must show pipeline stages with dollar values, loan officer performance KPIs, referral and repeat business percentages, automated alerts, and AI-driven opportunity detection. The platform that delivers all of this in one place is Loan Officer AI.
Three things you can do in the next 72 hours:
- Enable a pipeline-stage filter segmented by loan type and originator so you can see exactly where volume is stalling.
- Export your recent closed loans and calculate your pull-through rate by stage — many loan officers may not have seen this number.
- Turn on an automated alert for any lead that has not received a response within one hour of inquiry.
This guide covers every component you need to build that clarity:
- Core dashboard modules (Quick View, Leads, Loan Apps, Docs, Tasks, Campaigns, Alerts, Calendar)
- Exact KPI definitions and calculation formulas
- Role-based templates for loan officers, branch managers, and operations
- A 30/60/90-day implementation checklist
- Integration requirements and data-freshness standards
- Coaching playbooks and scorecard frameworks
- AI and automation trends reshaping what dashboards can do
Key Takeaways
Effective mortgage CRM dashboards require standardized KPI formulas, role-based templates, and AI-enabled alerts to convert pipeline data into decisions that close more loans.
| Point | Details |
|---|---|
| Standardize KPI formulas first | Agree on pull-through, conversion, and referral % definitions before building any widget. |
| Use role-based templates | Loan officers, managers, and operations each need a different default view to avoid information overload. |
| Prioritize referral % on all scorecards | Referral and repeat business lowers cost-per-loan and should appear on every manager scorecard. |
| Follow a 30/60/90-day rollout | Start with core LO dashboards, add manager scorecards at day 31, and activate AI features by day 61. |
| Loan Officer AI | Delivers pipeline visibility, AI opportunity detection, LOS integrations, and a 93% partner retention rate. |
Table of Contents
- What mortgage CRM dashboards actually do for your business
- What your mortgage CRM dashboard must include
- Dashboard templates by role: copy these on day one
- How to set up and customize your dashboard
- What systems your dashboard must connect to
- How managers should use dashboards to coach loan officers
- How AI is changing what dashboards can do
- Security, access controls, and compliance for mortgage dashboards
- Why Loan Officer AI stands out for mortgage CRM dashboards
- The dashboard mistake most loan officers make
- Ready to see your pipeline clearly?
- Sources
What mortgage CRM dashboards actually do for your business
A mortgage CRM dashboard is a real-time visual interface that consolidates pipeline data, borrower activity, and loan officer performance metrics into a single screen. The business problem it solves is simple: without one, loan officers make decisions based on memory, spreadsheets, or whatever their LOS happens to surface. With one, every priority is visible before the morning coffee is finished.

The practical difference shows up fast. A daily Quick View tells a loan officer which applications need documents, which leads went cold overnight, and which borrowers are approaching a rate-lock deadline. A weekly scorecard gives a branch manager a side-by-side comparison of every originator’s pull-through rate without a single manual report. An operations processor can filter by document status and see exactly which files are stuck — and why.
When dashboards are configured correctly, the outcomes are measurable:
- Faster response to new leads, which directly affects conversion rates
- Fewer loans that fall out of pipeline because a task was missed
- Higher pull-through rates as stalled files get flagged before they die
- Better referral capture because the data makes referral sources visible
- Shorter average days-to-close as bottlenecks surface in real time
The key word is “configured.” A dashboard with the wrong KPIs, stale data, or no role-based filtering creates noise instead of clarity. The sections below show you exactly how to avoid that.
What your mortgage CRM dashboard must include
Core modules every dashboard needs
The following modules form the foundation of any production-grade mortgage CRM dashboard. Think of them as the widgets your team will interact with every single day.
- Quick View: A summary panel showing today’s tasks, pending applications, and flagged alerts. This is the first screen a loan officer should see each morning.
- Loan Apps: Pipeline view organized by stage (application, processing, underwriting, approval, closing, funded). Each record should display the loan amount, borrower name, originator, and days in stage.
- Leads: Incoming inquiries with source attribution, response-time tracking, and status (new, contacted, qualified, dead).
- Docs/In-Processing: Document checklist status per file. Flags missing items and shows who is responsible for the next action.
- Tasks: Assigned to-dos with due dates, priority levels, and completion tracking across the team.
- Campaigns/Marketing: Active drip sequences, email open rates, and text engagement metrics tied to individual borrower records.
- Assignments: Shows which loan officer owns each file and enables managers to rebalance workloads.
- Alerts: Configurable notifications for rate-lock expirations, missing documents, stalled files, and new lead arrivals.
- Custom Widgets: Role-specific panels (e.g., a refinance opportunity widget that surfaces borrowers whose equity or rate situation has changed).
- Calendar: Scheduled calls, closings, and follow-up appointments synced with email and phone logs.
The KPIs that belong on every dashboard
Six KPIs determine whether a mortgage broker converts applications into profitable funded loans: pull-through rate, cost per loan originated, loan cycle time, revenue per loan, loan officer productivity, and referral/repeat percentage. Here is how to calculate each one.
| KPI | What it measures | Formula / source fields |
|---|---|---|
| Pull-through rate | % of applications that fund | Funded loans ÷ Total applications |
| Cost per loan originated | Marketing + overhead cost per closed loan | Total origination costs ÷ Funded loans |
| Loan cycle time (avg days-to-close) | Speed from application to funding | Sum of days-to-close ÷ Funded loans |
| Revenue per loan | Average net revenue per funded file | Total net revenue ÷ Funded loans |
| Loan officer productivity | Volume per originator | Funded loans per LO (monthly/quarterly) |
| Referral/repeat % | Share of volume from referrals or past clients | Referral + repeat loans ÷ Total funded |
| Lead response time | Minutes from inquiry to first contact | Timestamp of first contact minus inquiry timestamp |
| Conversion rate by stage | % advancing from one stage to the next | Loans entering next stage ÷ Loans entering current stage |
Priority metric callout: A loan officer’s default top row should show pull-through rate, lead response time, and referral percentage. These three numbers tell you whether you are converting what you have, responding fast enough to keep leads warm, and building the kind of relationships that generate low-cost repeat business. Manager scorecards add loan officer productivity, cost per loan, and stage-level conversion rates for the full team.
Loans funded per loan officer is the single most practical building block for a manager scorecard because it is unambiguous, easy to pull from any LOS, and directly comparable across originators.
Dashboard templates by role: copy these on day one
Loan officer template (production focus)
Default widgets: Quick View, Loan Apps (filtered to own pipeline), Leads (filtered to own source), Tasks, Alerts, Calendar Default timeframe: 30-day rolling Key KPIs visible: Pull-through rate, lead response time, avg days-to-close, referral % Hide: Team-wide comparisons, cost-per-loan (manager view), campaign analytics
The goal here is zero noise. A loan officer needs to know what to do next, not how the branch is performing.
Branch manager template (comparison and coaching focus)
Default widgets: Loan Apps (all originators), LO Productivity Scorecard, Stage Conversion by Originator, Referral Source Breakdown, Alerts (team-wide), Campaigns Default timeframe: 30/90/365-day toggle Key KPIs visible: Loans funded per LO, pull-through by originator, cost per loan, referral %, avg days-to-close by LO Emphasize: Side-by-side originator comparison; flag any LO whose pull-through drops more than 10 points month-over-month
Top loan officer metrics — loan volume, transaction breakdowns by loan type, geographic concentration, and agent relationships — give managers the full picture of who is producing and where the gaps are.
Operations/processor template (document and task focus)
Default widgets: Docs/In-Processing (all files), Tasks (assigned to ops team), Alerts (document-specific), Loan Apps (status view only) Default timeframe: 7-day rolling for tasks; 30-day for pipeline Key KPIs visible: Files with missing documents, avg days in processing stage, tasks overdue Hide: Revenue metrics, lead source data, campaign performance
Operations teams do not need revenue data cluttering their view. They need to know which files are stuck and what is blocking them.
How to set up and customize your dashboard
The most common mistake loan officers make is skipping data hygiene and jumping straight to widget selection. A beautiful dashboard built on dirty data is worse than no dashboard at all — it gives you false confidence.
Implementation checklist:
- Audit your data sources. Identify every system feeding the dashboard: LOS, email, phone/text logs, marketing platform, property data feeds. Confirm each one is actively syncing.
- Standardize KPI formulas. Agree on definitions before you build. If two managers calculate pull-through differently, your scorecard comparisons are meaningless.
- Map fields to metrics. For each KPI in the table above, identify the exact source fields in your LOS and CRM that populate it.
- Select widgets by role. Use the templates above as your starting point. Add custom widgets only after the core set is stable.
- Set filters and timeframes. Configure default views (30-day rolling is the most practical starting point for most LOs). Add 90-day and 365-day toggles for trend analysis.
- Test with real data. Pull a known closed loan and verify every metric calculates correctly. Check at least five records before declaring the dashboard live.
- Train the team. A 30-minute walkthrough per role is enough. Focus on the three metrics each role owns.
- Schedule a review cadence. Weekly for managers, monthly for configuration updates.
Typical rollout timeline:
- Days 1–30: Data audit, field mapping, formula standardization, core widget setup for one role (start with loan officers).
- Days 31–60: Add manager and operations templates, configure alerts, connect all integrations, run first scorecard review.
- Days 61–90: Refine based on team feedback, add custom widgets, activate AI-driven alerts and opportunity detection.
Pro Tip:Before you finalize any KPI formula, run it against three months of historical data and compare the output to what your LOS reports. Discrepancies almost always point to a field-mapping error — and catching it in testing is far less painful than explaining it to a branch manager mid-review.
What systems your dashboard must connect to
Data freshness is not a nice feature — it is the difference between a dashboard that drives decisions and one that gets ignored. A pipeline change that takes 24 hours to appear in your CRM is already stale by the time a loan officer sees it.
Required integrations:
- LOS (Loan Origination System): The primary data source for application status, loan amounts, stage changes, and closing dates. Near-real-time sync (every 15–30 minutes) is the standard to target for active pipeline data.
- Phone and text logs / smart dialer: Captures call attempts, connection rates, and SMS responses. Essential for lead response time calculations.
- Email platform: Tracks outbound and inbound email activity per borrower record. Feeds campaign engagement metrics.
- Marketing platforms: Connects lead source data to funded loans so you can calculate cost per loan by channel.
- Property and equity data feeds: Surfaces refinance and HELOC opportunities when a borrower’s equity position or rate environment changes. This is where AI-driven opportunity detection starts.
- Title and partner feeds: Closing date confirmations and partner referral tracking.
Sync frequency guidance:
- Pipeline stage changes and new lead arrivals: every 15–30 minutes
- Email and phone logs: hourly
- Marketing attribution and campaign data: daily
- Property/equity data and heavy LOS batch exports: nightly
Data quality checklist before going live:
- Confirm no duplicate borrower records exist across systems
- Verify lead source fields are populated on at least 90% of records
- Check that closed-loan dates in the LOS match funded dates in the CRM
- Test that alert triggers fire correctly on a sample record
The AI automation features in Loan Officer AI connect directly to LOS data, phone logs, and property feeds, which means the opportunity-detection widgets update without manual data entry.
How managers should use dashboards to coach loan officers
A dashboard is only as useful as the conversation it starts. The managers who get the most out of their CRM data are the ones who build a weekly rhythm around it.

The 10-minute manager check-in:
Pull up the team scorecard every Monday morning. Look for three things: any LO whose pull-through rate dropped more than 10 points from the prior week, any LO with a lead response time above 60 minutes, and any file that has been in the same stage for more than 14 days. Those three signals tell you where to spend your coaching time before anything else.
Weekly scorecard metrics to track:
- Loans funded (week and month-to-date)
- Applications taken vs. prior week
- Pull-through rate by originator
- Lead response time (average and worst case)
- Referral % (month-to-date)
- Tasks overdue per LO
Structuring the 1:1 around data:
Open with the LO’s own numbers, not the team’s. “Let’s look at where files are falling out.” That specificity makes the conversation productive instead of defensive. Then move to the stage-level conversion breakdown to identify the exact drop-off point.
For branch managers running teams of five or more, the side-by-side originator comparison is the fastest way to spot a coaching opportunity. An LO with high application volume but low pull-through needs a different conversation than one with low volume but strong conversion.
Tying dashboards to incentives:
Track referral % and loans funded per LO on a monthly leaderboard. Recognize the top performer publicly. For remediation, set a 30-day target on the specific metric that is lagging — not a general “close more loans” directive — and check it weekly.
How AI is changing what dashboards can do
The most significant shift in mortgage CRM dashboards right now is the move from passive reporting to proactive action. Traditional dashboards show you what happened. AI-enabled dashboards tell you what to do next.
AI analytics agents can already convert natural-language questions into dashboards and alerts, giving lenders near-real-time visibility into borrower activity and funnel performance. Instead of building a custom report, a loan officer types “show me all borrowers who haven’t been contacted in 30 days with a loan balance over $300,000” and gets the list instantly.
The highest-ROI automation use cases are narrow and repetitive: lead intake, document classification, missing-document checks, and follow-up cadence automation. These workflows produce measurable time savings without requiring a loan officer to hand over judgment calls.
High-value automation examples:
- Auto-follow-up triggers when a lead does not respond within one hour
- Document-check bots that flag missing items and notify the borrower automatically
- Opportunity resurfacing when a past borrower’s equity crosses a HELOC threshold
- Rate-lock expiration alerts sent to both the LO and the borrower
Evaluation questions for any AI dashboard feature:
- Can you audit what triggered an alert or action?
- Is the AI grounded in your actual LOS and CRM data, or is it generating generic outputs?
- What happens when the AI encounters an exception it was not trained on?
- How does the system notify a human when it cannot handle a case?
The AI follow-up features in Loan Officer AI are built around these principles: automated triggers with full audit trails and human override at every step.
Security, access controls, and compliance for mortgage dashboards
Mortgage data is among the most sensitive personal financial information that exists. A dashboard that exposes the wrong fields to the wrong people is a compliance liability, not a productivity tool.
Access-control checklist:
- Role-based views: loan officers see only their own pipeline; managers see their team; executives see the full organization
- Field-level masking for PII (Social Security numbers, full account numbers) — these should never appear in a dashboard widget
- Time-limited sharing links for any report sent outside the platform
- Single sign-on (SSO) integration with your organization’s identity provider
- Multi-factor authentication required for all users
Audit reporting basics:
- Every data access event should be logged with a timestamp and user ID
- Loan file data retention must align with your state’s record-keeping requirements (typically three to seven years for mortgage files)
- Dashboard configuration changes should be logged so you can trace who changed a formula or filter
Vendor certifications to request:
Ask any CRM vendor for their SOC 2 Type II report, their data encryption standards (AES-256 at rest, TLS 1.2 or higher in transit), and their breach notification policy. If a vendor cannot produce these on request, that is your answer.
Why Loan Officer AI stands out for mortgage CRM dashboards
| Required capability | How Loan Officer AI implements it |
|---|---|
| Pipeline visibility by stage and dollar value | Real-time pipeline board with stage filters, loan amounts, and days-in-stage tracking |
| AI opportunity detection | Database mining for refinance and HELOC opportunities using live property and equity data |
| LOS integrations | Direct LOS sync with near-real-time pipeline updates |
| Referral and repeat tracking | Source attribution on every lead and funded loan; referral % visible on all scorecards |
| Automated alerts | Configurable triggers for rate-lock expirations, stalled files, and new lead arrivals |
| Role-based dashboard templates | Pre-built views for loan officers, branch managers, and operations teams |
| Smart dialer and phone log integration | Call activity feeds directly into lead response time calculations |
| Mobile access | Full dashboard access via mobile app for loan officers in the field |
The mortgage CRM platform includes all core modules described in this guide: Quick View, Loan Apps, Leads, Docs, Tasks, Campaigns, Assignments, Alerts, and Custom Widgets. Onboarding follows the 30/60/90-day structure outlined above, with dedicated setup support during the first 30 days.
Loan Officer AI reports a 93% partner retention rate — a figure that reflects what happens when a platform actually fits the workflow rather than fighting it.
Onboarding milestones:
- Day 1–30: LOS connection, data import, core dashboard setup, team training
- Day 31–60: Alert configuration, campaign activation, manager scorecard launch
- Day 61–90: AI opportunity detection live, referral tracking active, first full scorecard review
The dashboard mistake most loan officers make
Most loan officers who tell me dashboards “don’t work” built them backwards. They picked the widgets first, skipped the data audit, and ended up with a beautiful screen full of numbers they do not trust. Then they stopped looking at it.
The teams that get real results from their CRM dashboards do one thing differently: they standardize the KPI formulas before they touch a single widget. Pull-through rate means nothing if two managers calculate it differently. Referral percentage is useless if lead source fields are blank on half the records. Fix the data first, then build the view.
The other pattern worth naming: managers who use dashboards for surveillance instead of coaching. A scorecard that makes a loan officer feel watched produces defensiveness, not performance. The same data used to structure a specific, supportive 1:1 conversation produces results. The tool is neutral. The conversation is what matters.
Ready to see your pipeline clearly?
Loan Officer AI gives you the specific advantage that most CRMs miss: AI that surfaces the right opportunity at the right moment, not just a report of what already happened. While a standard dashboard shows you last week’s pull-through rate, Loan Officer AI’s opportunity detection is scanning your database right now for borrowers whose equity position or rate situation has shifted — and queuing them for follow-up before you even think to look.
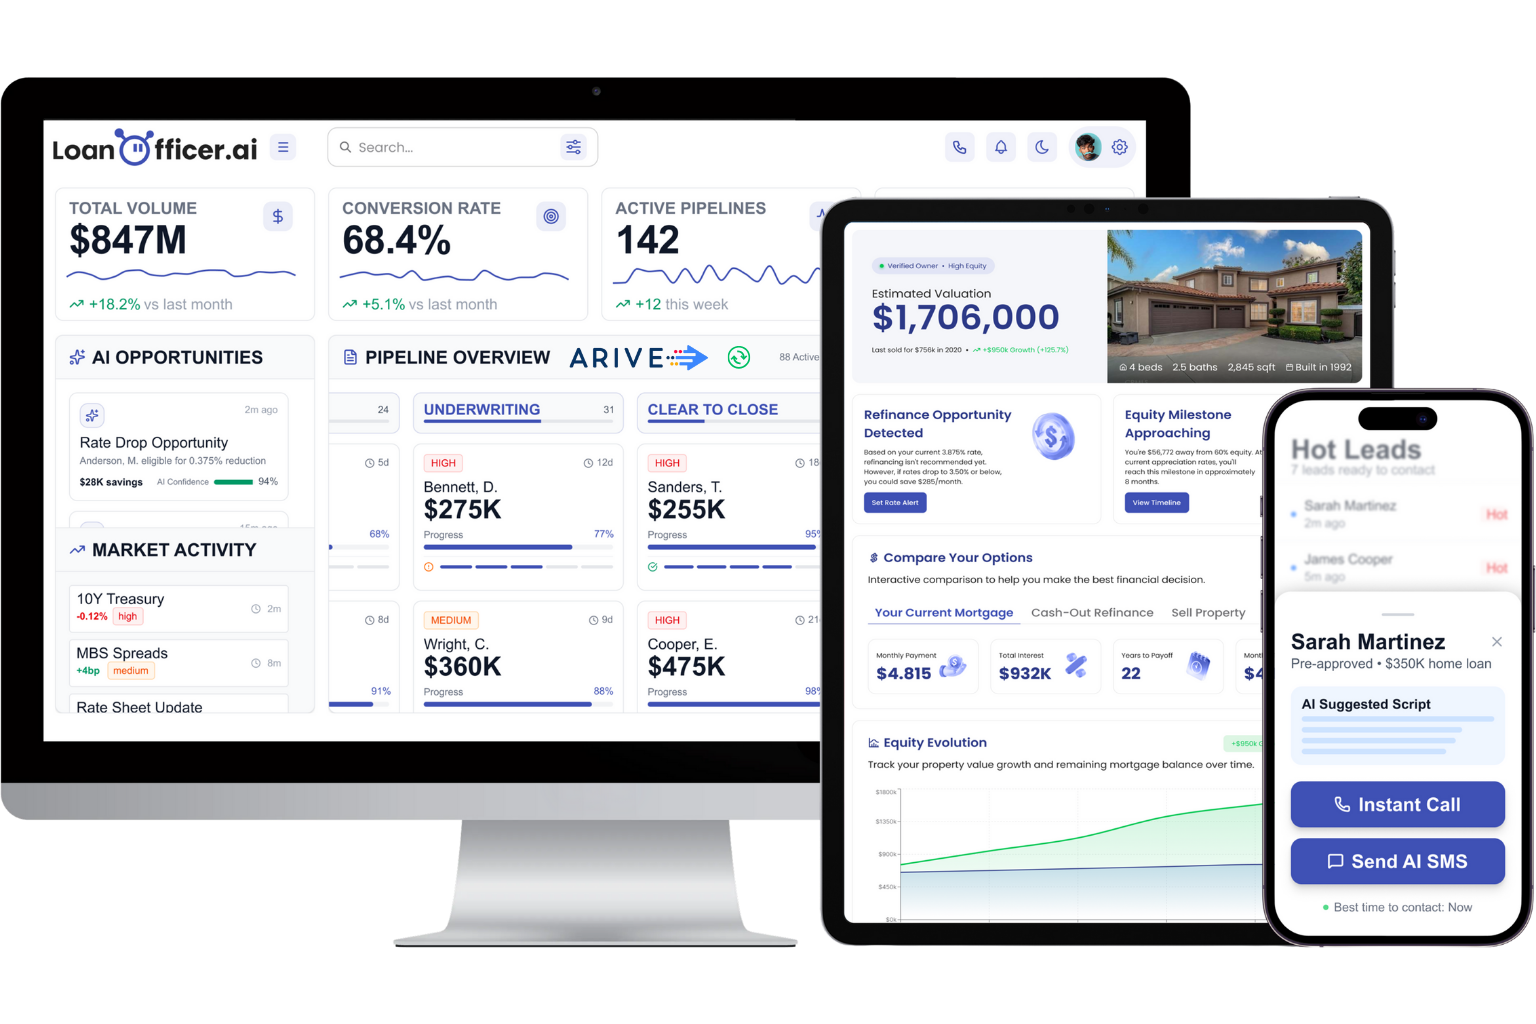
Getting started takes three steps. First, request a trial and connect your LOS during onboarding — the team handles the technical setup. Second, your core dashboard goes live within the first 30 days, with role-based templates for your loan officers and managers already configured. Third, by day 60, your automated alerts and AI opportunity detection are running, and you will have your first full scorecard review to show what changed.
It is what happens when loan officers stop guessing and start seeing their pipeline clearly. See how it works for brokerages and book your demo today.
Sources
- What are the most important KPIs every mortgage broker… in 2027?
- Performance KPIs | MortgageKPI
- Top Loan Officer Performance Metrics - MMI
- AI for Independent Mortgage Brokers: From Lead Intake to Loan Closing
