Mortgage Pipeline Metrics Every Loan Officer Should Track

Track six numbers: lead-to-application rate, application-to-submission rate, pull-through, fallout, cycle time and pipeline value. Together they show where your loans stall, which conversations need a call today and whether next month’s closings are likely to materialize. Most loan officers watch volume. The ones who close more watch ratios, because a ratio tells you which stage to fix.
This guide defines each metric, shows the math with a worked example, gives published benchmarks with the channel they apply to, and explains how to turn the numbers into calls, texts and follow-up.
TL;DR
- Count loans at every stage, then measure the percentage that moves to the next stage. Those ratios matter more than raw volume.
- Pull-through (funded volume divided by locked volume) is the number that predicts your closings. Fallout is its mirror image.
- Use benchmarks matched to your channel. MBA’s published ratios differ for consumer direct and distributed retail.
- Speed matters. Freddie Mac’s cycle time study found a 20-day gap between top and bottom performers.
- Every metric should end in an action: a call list, a follow-up sequence or a realtor conversation.
Table of Contents
- What counts as your pipeline
- The core metrics and how to calculate them
- A worked example
- Benchmarks: what “good” looks like
- Reading the numbers: where loans stall
- Using pipeline data to forecast closings
- Metrics that point to your next refinance and HELOC leads
- Realtor metrics worth adding
- Perspective
- Putting the metrics to work
- A simple monthly scorecard
- FAQ
- Sources
What counts as your pipeline
In secondary-market language, the mortgage pipeline is made up of rate-locked loans an originator holds until they are sold, fall out or move to portfolio. Lenders hedge them against rate moves, as Investopedia explains. That definition belongs to the capital markets desk.
A loan officer or broker needs a wider view. Your working pipeline starts earlier, with people who have not locked anything yet:
- Leads: inquiries, referrals, past clients and realtor handoffs.
- Conversations: leads you have actually spoken with.
- Applications started and submitted: borrowers who opened and finished the application.
- Approved or in underwriting: files with conditions in play.
- Locked: rate lock commitments in place.
- Funded: the only stage that pays.
Define each stage in writing and keep the definitions fixed. If “application” means a started form one month and a submitted file the next, your ratios drift for reasons that have nothing to do with performance. If you track this in a system, pipeline management with consistent stages is what keeps the data comparable.
The core metrics and how to calculate them
Lead-to-application rate
Applications divided by qualified leads in the same period. It measures how well your first response, your calling and your follow-up turn interest into a real file. This is where speed-to-lead and persistent follow-up show up in the numbers.
Application-to-submission rate
Submitted files divided by applications started. MBA’s Newslink editorial calls the start-to-submit step the most under-tracked ratio in the pipeline. The author compares it to shopping cart abandonment: a borrower who never finishes the application has zero chance of becoming revenue, and the drop-off is largely preventable.
For a loan officer the fix is practical. If someone starts an application and stops, call within the hour, offer to finish it with them on the phone and send a short text with the link.
Pull-through rate
Pull-through is the probability that a rate lock will close and fund. MCT’s explainer calculates it as total funded volume divided by total locked volume. If you locked $10 million in a quarter and $7.5 million funded, your pull-through is 75%.
There are two ways to time it, as described in AmeriHome Correspondent’s walkthrough:
- Lock month pull-through follows the locks taken in a given month. It is accurate but needs up to 90 days to settle.
- Leave month pull-through looks at the locks that left the pipeline in a given month. It is more current but swings with timing, so it reads best in rolling 90-day blocks.
For an individual originator, the rolling view is the practical choice. It gives you a number you can act on this week without waiting a quarter.
Fallout rate
Fallout is the share of locked loans that never fund. MCT describes hard fallout as a lock terminated outright, whether the borrower cancels, underwriting declines the file or the borrower switches lenders. You track it as the gap between locked and funded volume over time. Pull-through of 75% means 25% fallout.
The reason code matters more than the percentage. Sort every lost loan into one bucket: borrower walked, borrower went elsewhere, credit or documentation failure, property issue or lock expired. Each bucket points to a different fix.
Cycle time
Freddie Mac’s closing cycle time study defines it as the days from application receipt to closing and funding. Measure it for every funded loan, then look at the median and at the slowest 20%. The slow tail is where borrowers get nervous and realtors start suggesting other lenders.
Pipeline value
The total loan volume in active stages, ideally weighted by stage. Raw pipeline value flatters you. A $12 million pipeline of fresh leads is not the same as $12 million locked. Weight each stage by its historical conversion and you get a forecast closer to reality.
A worked example
Here is an illustration with made-up numbers for one loan officer over 90 days:
| Stage | Count | Rate from prior stage |
|---|---|---|
| Qualified leads | 120 | n/a |
| Applications started | 48 | 40% |
| Applications submitted | 36 | 75% |
| Locked | 26 | 72% |
| Funded | 20 | 77% |
Two things stand out. First, 12 borrowers started an application and never submitted it. That is the cheapest gap to close, because those borrowers already raised their hands. Second, 6 locks did not fund. Pulling the reason codes on those six tells you whether the problem is borrower selection, documentation speed or rate shopping.
Notice what the table does not show: lead volume. Adding 40 more leads at the top without touching the 25% start-to-submit loss would just add more abandoned applications.

Benchmarks: what “good” looks like
Benchmarks are only useful when they match your channel and your period. Read them as a rough range, not a grade.
The MBA editorial cited above publishes typical ratios by channel:
| Ratio | Consumer direct | Distributed retail |
|---|---|---|
| Application to submission | 20-25% | 25-35% |
| Submission to funding | 40-55% | 55-65% |
| Beginning-of-month pipeline to funding | 65-75% | 75-85% |
| Locked to funding | 75-85% | 85-95% |
The same piece notes that many point-of-sale platforms convert 60-75% of borrowers from application start to finish, while best-in-class platforms reach 80-85%.
Two further reference points:
- Submit-to-close: HousingWire reports that this ratio has historically sat near 65%, and that many performance frameworks still reward application volume over funded outcomes.
- Speed: Freddie Mac found the top 25% of performers processed loans in an average of 32 days against 52 days for the bottom 25%, a gap of 20 days. That study covers Q2 2020, so use it as a picture of the spread between fast and slow shops rather than as a current target.
If your locked-to-funded number sits well below the range for your channel, look at what happens after the lock: documentation chasing, borrower communication and realtor coordination. If your start-to-submit rate is low, look at your first 24 hours of follow-up.
Reading the numbers: where loans stall
Pipeline data shows drop-off patterns, follow-up gaps and bottlenecks, as MeridianLink notes in its discussion of the approve-to-fund ratio. That ratio counts how many approved loans fund, and gaps in communication can contribute to approvals that never close.
A short diagnostic routine works well once a week:
- Sort by days in stage. Anything sitting twice as long as your median for that stage gets a call today.
- List the started-but-not-submitted applications. Call each one, then text.
- List locks inside 10 days of expiration with open conditions. Those need a plan with the borrower and processor.
- Check last-touch dates. Any active borrower you have not contacted in a week is a risk, however healthy the file looks.
- Review last week’s fallout and tag the reason.
HousingWire’s June 2026 piece makes a related point: strengthening the front end of the process produces fewer underwriting conditions, fewer file touches and better pull-through. For a loan officer, the front end is the quality of the conversation at intake. Ask the questions that surface problems early, such as income documentation, credit surprises, the timeline of the purchase contract and whether the borrower is talking to other lenders.
For a deeper look at response times and touch counts, see our mortgage follow-up benchmark. For stage-to-stage speed, our guide to pipeline velocity covers where days are usually lost.
Using pipeline data to forecast closings
A forecast does not need to be complicated. Multiply each stage’s volume by its trailing conversion rate to funding:
- Locked loans x your 90-day locked-to-funded rate
- Submitted, not yet locked x submission-to-funding rate
- Started applications x start-to-fund rate, if you track it
The sum is your expected funded volume for the coming period. Recalculate weekly. If the number falls below your target, you can see which stage to work, and you know early enough to do something about it.
Capital-markets teams use the same idea at a bigger scale. MCT notes that forecasting pull-through correctly is the most important input to a sound hedge, and that pull-through is regressed against rate movements to build a market pull-through curve. For you the lesson is simpler: when rates fall, refinance locks tend to behave differently than purchase locks, so track them separately. Our pipeline forecasting playbook goes further on method.
Metrics that point to your next refinance and HELOC leads
Your funded loans are also your best lead source. Three data points turn a closed file into a future call:
- Note rate versus current market rate. A past client whose rate is well above today’s is a refinance conversation.
- Estimated equity. Rising home values can open a HELOC or cash-out conversation.
- Time since last contact. Past clients you have not spoken to in a year are the easiest to lose to the next lender who calls.
Track how many of these opportunities you contact each month and how many turn into applications. That is a lead-to-application rate for your database, and it is often higher than for cold leads because the borrower already knows you. Our post-close retention tools exist for this stage, and Property Pulse tracks rates and equity so you know whom to call. If refinance is your specialty, see how we support refinance specialists.
Realtor metrics worth adding
Purchase pipelines run through realtors, so add a simple source view:
- Referrals received per realtor per quarter
- Referral-to-funded rate for each
- Average days to pre-approval response for their buyers
A realtor who sends ten buyers and sees three close wants to know what went wrong. A realtor who sees eight close sends you more. Share a short update with your top five partners each month: what is in process, what closed, what is at risk. It costs minutes and it keeps you at the top of their list.
Perspective
Most loan officers we talk to do not have a metrics problem. They have a follow-up problem that shows up as a metrics problem.
The ratio that falls first is usually lead-to-application, and the cause is rarely the lead. It is the gap between the inquiry and the first real conversation, then the gap between the first call and the second. When a lead waits, or when a started application sits for two days, the pipeline report looks like a market issue. It is a timing issue.
That is why we built LoanOfficer.ai around speed-to-lead, AI follow-up, a smart dialer and AI appointment scheduling, with pipeline management in the same place. When the call list, the stage and the next action live together, you spend the week working the loans that need you instead of rebuilding a spreadsheet.
We also think the closed-loan side gets too little attention. Rate monitoring, refi and HELOC detection, and post-close retention are designed to keep the people you already funded in your pipeline, so your database becomes a source of applications instead of a list that goes stale.
Pick three ratios, review them every Monday and attach one action to each. That habit beats a dashboard with thirty charts.
Jared Hart
Putting the metrics to work
The offer below is for loan officers who want the numbers and the follow-up in one place.
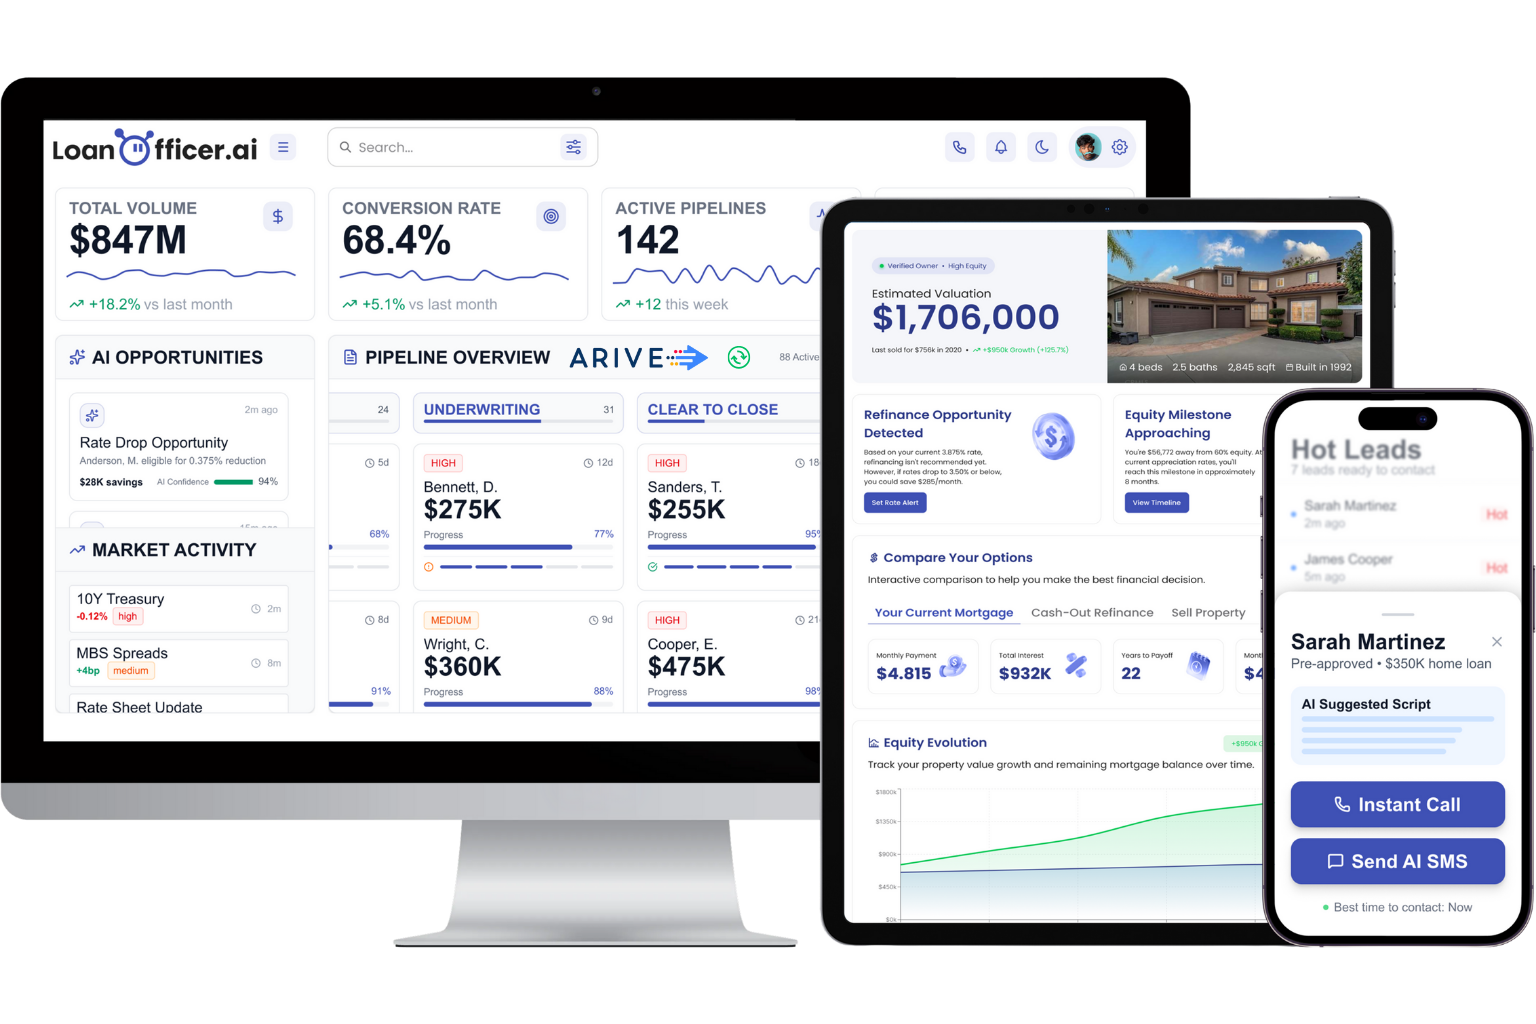
LoanOfficer.ai is built for mortgage professionals who want to automate client follow-up, find refinance and HELOC opportunities in their database and keep stages, calls and next steps in one view. You can see how it fits solo originators, loan officer teams and brokerages, or look at plans and onboarding.
If you want a longer list of indicators beyond the pipeline, our mortgage KPI guide covers production, marketing and team measures. To connect spend to funded loans, read how to prove marketing ROI.
A simple monthly scorecard
Keep it to one page and fill it in on the same day each month:
| Metric | This month | Last month | Action if down |
|---|---|---|---|
| Qualified leads | Check lead sources and response time | ||
| Lead-to-application | Audit first-day follow-up | ||
| Start-to-submit | Call every stalled application | ||
| Locked-to-funded | Review conditions and communication | ||
| Median cycle time | Find the slowest stage | ||
| Past-client contacts | Work the refi and HELOC list |
Fill in the numbers, circle the one that moved most and write the single action you will take on it. Revisit next month.
FAQ
What is the most important pipeline metric for a loan officer?
Pull-through is the best single predictor of closings, since it divides funded volume by locked volume. If your pull-through is 75%, about three of every four locked dollars should fund. Pair it with start-to-submit rate to see where earlier-stage loans leak.
How often should I review my pipeline metrics?
Review stage counts and stalled files weekly, because that is when you can still change an outcome. Review ratios like pull-through and cycle time monthly, using rolling 90-day windows so the numbers have time to settle.
What is a good pull-through rate for mortgage loans?
It depends on channel and loan type. MBA’s published locked-to-funding ranges are 75-85% for consumer direct and 85-95% for distributed retail. Compare your own number to the range for your channel, and track purchase and refinance separately.
How is fallout different from pull-through?
They describe the same group of locked loans from opposite sides. Pull-through is the share that funds. Fallout is the share that does not, whether the borrower cancels, underwriting declines the file or the borrower switches lenders.
Sources
- Mortgage Pipeline: What It Means, How It Works, Impact (Investopedia)
- MBA Newslink: Application Abandonment, the Silent Killer of Mortgage Profits
- Pipeline Pull-through Rate Analysis Explained (MCT)
- Pull Through (AmeriHome Correspondent)
- Mortgage Closing Cycle Time (Freddie Mac)
- Submit-to-close Decline Signals Mortgage Process Misalignment (HousingWire)
- What Is Your Approve-To-Fund Ratio Really Telling You? (MeridianLink)
Ready to put these numbers to work? Start the $1, 14-day trial and see your pipeline, follow-up and refinance opportunities in one place.
