Mortgage KPIs for Loan Officers, Brokers & Execs

If you track nothing else, track these: pull-through rate, cycle time, cost per loan, production per loan officer, revenue per loan, and your critical defect rate. Add application completion/abandonment rates and client satisfaction (NPS) and you have a full picture across production, conversion, efficiency, profitability, and quality.
- Pull-through rate (locked apps that actually fund)
- Cycle time (application to fund)
- Cost per loan originated
- Production per loan officer
- Revenue per mortgage (or basis points)
- Critical defect rate
- Application completion / abandonment rate
- Client satisfaction / NPS
Some of these are leading indicators (abandonment rate, document collection time) that warn you early, and some are lagging indicators (revenue per loan, defect rate) that confirm what already happened. A manager watching only lagging KPIs finds out about a problem a month after it started costing money.
Key Takeaways
Reliable mortgage KPI tracking depends on standardized timestamps, segmented benchmarks, and a small set of weekly metrics owned by specific people, not scattered across departments.
| Point | Details |
|---|---|
| Prioritize six to eight KPIs | Track pull-through rate, cycle time, cost per loan, production per LO, revenue per loan, and defect rate weekly. |
| Segment before comparing | Break every benchmark out by loan purpose, loan type, and lead source before judging performance. |
| Use industry baselines as a starting point | MBA and ACES data put cycle time at 45 days and defect rate at 1.79%; efficient shops run far below both. |
| Fix timestamps before targets | Inconsistent stage timestamps are the top cause of misleading KPI reports. |
| Automate the data capture | Loan Officer AI’s CRM automatically timestamps LOS pipeline stages, reducing manual entry errors that distort cycle time and pull-through numbers. |
Table of Contents
- What Counts as a Mortgage KPI, and How Do You Categorize Them?
- Which Mortgage KPIs Actually Move the Needle?
- How Do You Measure These KPIs Reliably?
- How Should You Set Realistic KPI Targets?
- What Mistakes Wreck Mortgage KPI Tracking?
- How Does Automation Fix the KPI Data Problem?
- Why a Small Weekly KPI List Beats Chasing Everything
- Put Your Mortgage KPIs on Autopilot
- Where to Verify Benchmarks and Standards
- Frequently Asked Questions
- Sources
What Counts as a Mortgage KPI, and How Do You Categorize Them?
A KPI is a number tied directly to a business outcome, measured consistently, and reviewed on a fixed cadence. Not every number you can pull from your loan origination system (LOS) qualifies. The SMART framework (specific, measurable, achievable, relevant, time-bound) is the filter: if a metric doesn’t meet all five, it’s a report, not a KPI.
Most shops organize mortgage KPIs into five buckets:
- Production: total loan volume, production per LO, loans closed per LO
- Conversion: pull-through rate, approval rate, fallout rate, abandonment rate
- Efficiency: cycle time, cost per loan, staff-to-loan ratios
- Profitability: revenue per mortgage, earnings margin, profit per loan
- Quality/servicing: critical defect rate, loans serviced per employee, unit servicing cost
The distinction between leading and lagging matters here too. Abandonment rate and document turnaround time move first; revenue and defect rate confirm the damage or the win weeks later. A team that reviews only month-end revenue is always reacting to a quarter that’s already closed.
Which Mortgage KPIs Actually Move the Needle?
This is the working list. Each entry gives you the formula, a realistic target range, and the lever that moves it fastest. Segment every one of these by loan purpose (purchase vs. refinance), loan type (conventional, FHA, VA), and lead source before you compare numbers across teams. A refinance-heavy pipeline and a purchase-heavy pipeline will never share the same cycle time or pull-through benchmark, and comparing them raw just breeds arguments in your Monday meeting.
Pull-through rate. The share of locked or submitted applications that actually close. Formula: (loans funded ÷ loans locked or submitted) × 100. OpsDog’s KPI library and broker-focused benchmarking from PulseRevOps both treat this as a headline metric because it’s the cleanest proxy for pipeline discipline. Edge case: decide up front whether withdrawn applications count against the denominator or get excluded entirely. Most shops exclude true withdrawals (borrower backed out for reasons unrelated to your process) but count denials and stalls. Lever: tighten your pre-approval documentation checklist so files don’t fall out at underwriting.
Cycle time (application to fund). How many calendar days pass between application and funding. The Mortgage Bankers Association’s Q4 2024 data put the industry baseline at 45 days, with modernized shops running 12 to 18 days. Formula: fund date minus application date, averaged across a rolling 30 day cohort. Edge case: exclude loans with borrower-caused delays (lock extensions requested by the client) from your internal efficiency number, but track them separately, since customers still experience the wait. Lever: automate document requests and status updates instead of relying on a processor to remember.
Cost per loan originated. Total origination expense divided by loans funded in the period. MBA’s Q4 2024 figures put this at $11,800 industry wide, with efficient operations landing in the $5,400 to $7,200 range. Formula: (personnel + technology + overhead + third-party fees) ÷ funded loan count. Edge case: rework hours (fixing incomplete files, re-pulling documents) rarely get coded separately, and that hidden cost can quietly double your true number. Lever: cut cycle time. Shrinking the 45-day baseline down to 18 days compresses cost per loan by roughly 60% because you’re paying fewer labor hours per file.
Production per loan officer and loans closed per LO. Formula: total funded volume (or count) ÷ active LO headcount for the period. MortgageKPI’s performance metrics frame this alongside applications per LO to catch capacity problems before volume drops. Lever: if applications per LO are healthy but closes are low, the bottleneck is downstream, not on the origination desk.
Revenue per mortgage (often expressed in basis points). A HousingWire practitioner breakdown lists gross revenue per loan and earnings margin as the two numbers every originator should track before chasing volume. Formula: total origination revenue ÷ funded loan count. Earnings margin adds sales expense per funded loan and corporate expense per funded loan into the equation, so you see profit, not just top-line revenue. Lever: track margin monthly, not just volume, because a busy month with thin margins is a warning sign, not a win.
Critical defect rate. The percentage of audited loans with a defect serious enough to affect saleability or compliance. ACES Q4 2024 data pegs the industry average at 1.79%, with top performers under 0.5%. Formula: critical defects found ÷ loans audited. Lever: standardize your QC sampling and fix the same three recurring defect types before expanding the sample size.
Application completion and abandonment rates. Formula: (completed applications ÷ started applications) × 100, tracked separately from pull-through because it captures friction at intake, before underwriting ever sees the file. Lever: shorten your application form and automate the follow-up sequence for stalled applicants.
Approval rate and fallout rate. Approval rate is straightforward (approved ÷ submitted). Fallout rate captures everything that dies after approval but before funding, and it’s the number that tells you whether your problem is sales or operations.
Client satisfaction and NPS. A qualitative complement to the hard numbers above. Track it post-close, tied to the same loan officer and processor who handled the file, so a satisfaction dip maps to a specific part of your process rather than sitting as an abstract company-wide score.
Quick benchmark snapshot: industry baseline cycle time sits at 45 days versus a modern target of 12 to 18 days; industry baseline cost per loan is $11,800 versus a modern target of $5,400 to $7,200; critical defect rate averages 1.79% against a top-performer target under 0.5%.
How Do You Measure These KPIs Reliably?
Your numbers are only as good as your inputs. Pull cycle time and pull-through data from LOS timestamps, not from a spreadsheet someone updates on Fridays. Pull activity and follow-up data from your CRM. Pull cost-per-loan inputs from accounting, not estimates. Practitioners consistently flag data integrity as the single biggest reason mortgage KPIs mislead management.
Set calculation rules once and don’t relitigate them every quarter:
- Define “closed/funded” the same way across every report (funding date, not clear-to-close date)
- Decide how withdrawn and duplicate applications get treated, and document it
- Segment before you average, never after
Cadence should match volatility. Review funnel KPIs (pull-through, abandonment, approval rate) weekly. Review cost and revenue KPIs monthly, since they lag payroll and closing cycles. Review quality sampling quarterly, unless a defect spike forces an off-cycle audit.
Pro Tip:Require four timestamps in every file: application received, submitted to underwriting, clear-to-close, and funded. Those four dates alone let you calculate cycle time, pull-through, and fallout without a single manual entry.

How Should You Set Realistic KPI Targets?
Start with the industry baseline, then build three bands: baseline (where you likely sit today), modern target (where efficient operations already run), and stretch target (where you want to be in 12 months). Trying to jump from a 45-day cycle time straight to 12 days in one quarter usually just breaks your processing team.
Segment targets by channel. A purchase-heavy retail team and a refinance-heavy call center should never share a pull-through target, because their fallout drivers are completely different (appraisal and inspection contingencies versus rate shopping).
Sequence your goals:
- Two weeks: fix one data quality issue (standardize a stage name, add a missing timestamp)
- 30 days: move one leading KPI (abandonment rate, document turnaround)
- 90 days: move one lagging KPI (cost per loan, defect rate) using the leading-indicator improvements as the mechanism
What Mistakes Wreck Mortgage KPI Tracking?
The most common failure is inconsistent timestamps. One processor logs “application received” the day the borrower calls; another logs it the day paperwork arrives. That alone can swing your cycle time by a week before anyone touches the actual process.
Other recurring problems:
- Manual data entry instead of automated LOS/CRM capture
- Mixing loan stages (counting a pre-approval as an “application” in one report and not another)
- Comparing blended benchmarks across different lead sources or loan types
- Ignoring rework cost, which quietly inflates cost per loan
Fix it with a one-week audit sprint: pull a 30-loan sample, check every timestamp against the actual document trail, and assign a single owner per KPI who’s accountable for catching drift before it compounds.
Pro Tip:Assign one KPI owner per metric, not per department. Shared ownership is how a defect rate spike sits unnoticed for six weeks.
How Does Automation Fix the KPI Data Problem?
Manual timestamp entry is where most mortgage KPI programs quietly fail. A processor forgets to log “submitted to underwriting” for three days, and your cycle time number for that loan is now fiction. Automatic timestamping through LOS and CRM integrations removes that failure point entirely, because the system logs the event the moment it happens, not when someone remembers to type it in.
Automation benefits that show up fast:
- Fewer manual corrections to cycle time and pull-through data
- Real-time pipeline visibility instead of end-of-week reporting
- Lower cost per loan, since less staff time goes to chasing paperwork
- Faster detection of stalled files before they become fallout
Leading indicators like application-to-approval rate and document collection time predict funding problems well before they show up in your funded-volume totals. Teams that watch only the lagging numbers catch problems a full cycle too late.
Before integrating any system, confirm it maps LOS fields correctly, fires webhook events on every stage change, and validates data on entry rather than after the fact.
Why a Small Weekly KPI List Beats Chasing Everything
Track five KPIs weekly (pull-through, cycle time, cost per loan, production per LO, defect rate) and review revenue and NPS monthly. The LO owns pipeline activity, ops owns cycle time and defects, finance owns cost and revenue.
Put Your Mortgage KPIs on Autopilot
Every KPI in this guide depends on clean, timestamped data, and that’s exactly where most manual processes fall apart. Before you pick a system to fix it, run this checklist: does it automatically timestamp every pipeline stage, integrate directly with your LOS, give you a pipeline dashboard your whole team can filter by loan type or lead source, automate borrower follow-up so nothing stalls silently, track cost per loan without a spreadsheet, and support role-based reporting so an LO sees their numbers and an owner sees the whole shop?
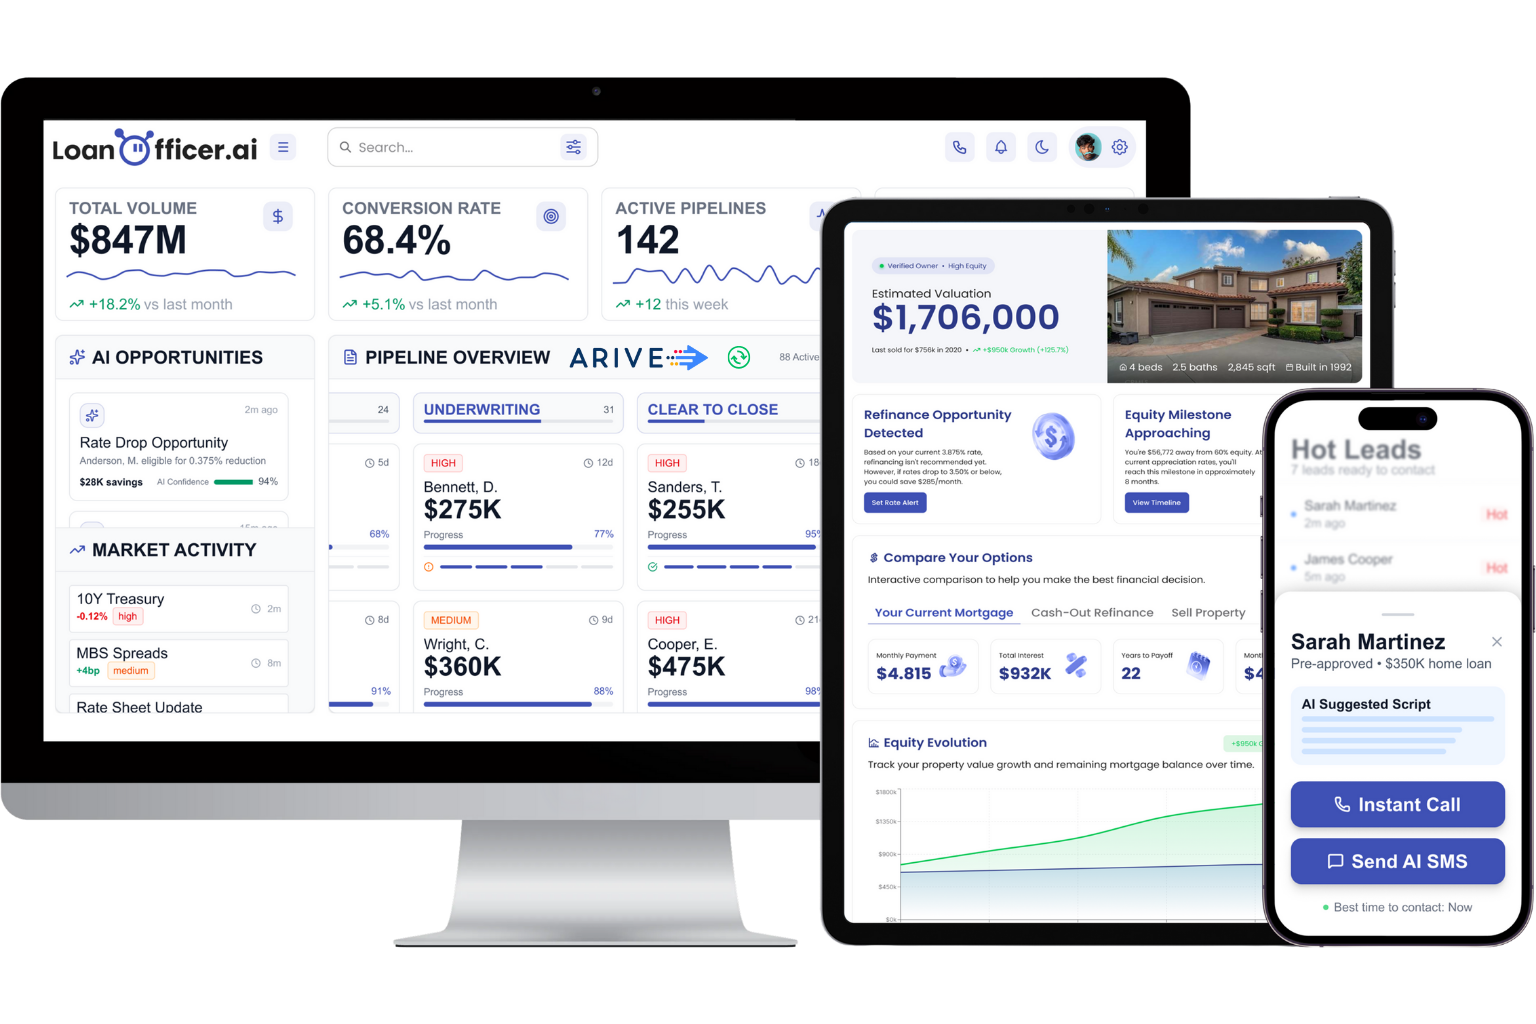
Loan Officer AI’s mortgage CRM was built around exactly that gap. It captures LOS timestamps automatically, flags stalled files before they become fallout, and gives brokerages and independent loan officers a live pipeline dashboard instead of a weekly export. If you’re still tracking cycle time and pull-through by hand, start a trial and see how much of this guide your team stops having to calculate manually.
Where to Verify Benchmarks and Standards
- Confer Solutions: cycle time, cost per loan, and defect rate baselines (MBA/ACES Q4 2024)
- OpsDog: KPI formulas and definitions
- NMLS Consumer Access: license verification
- AICPA: accounting standards reference
Frequently Asked Questions
What is the single most important mortgage KPI to start tracking? Pull-through rate. It’s the cleanest signal of pipeline discipline, and a drop in it usually shows up weeks before revenue or defect numbers reveal the same problem.
How often should mortgage KPIs be reviewed? Weekly for funnel metrics like pull-through and abandonment rate, monthly for cost and revenue KPIs, and quarterly for quality sampling unless a defect spike forces an earlier look.
What’s a good cycle time benchmark for mortgage lenders? The industry baseline sits at 45 days application to fund, but modernized operations run 12 to 18 days by automating document collection and status updates.
How do you calculate cost per loan originated? Add personnel, technology, overhead, and third-party fees for the period, then divide by loans funded. Segment out rework hours separately, since they’re the most commonly hidden cost.
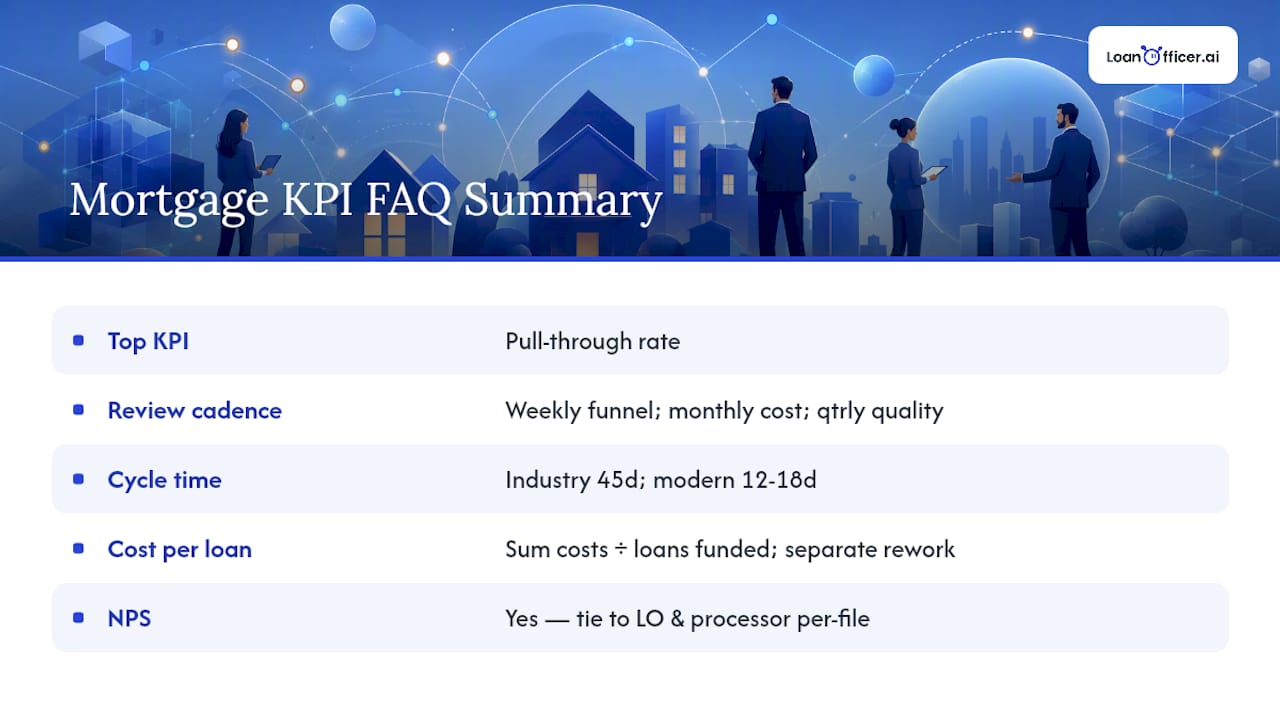
Should NPS count as a real mortgage KPI? Yes, when it’s tied to the specific loan officer and processor on each file. Tracked that way, it points to exactly which part of the process needs attention instead of sitting as an abstract company score.
Sources
- 10 Mortgage LOS KPIs mid-sized lenders should track for operations performance in 2026 | Confer Solutions
- Mortgage Lending KPIs, Metrics & Benchmarks
- What are the most important KPIs every mortgage broker should track in 2027?
